Schedule Entropy — Why Great Schedules Slowly Become Chaotic
Diagnosing, measuring and reversing disorder in a project controls environment — a field-tested playbook for planners, controls managers and PMO leaders.
By Dr. Hassan Eliwa, PhD — Founder of PMMilestone.org & PMMilestone.com · 2026-07-06
Schedule Entropy — Why Great Schedules Slowly Become Chaotic
By Dr. Hassan Eliwa, PhD — Founder of PMMilestone.org & PMMilestone.com · Updated 2026-07-06 · https://pmmilestone.com/career-guides/schedule-entropy-why-great-schedules-slowly-become-chaotic
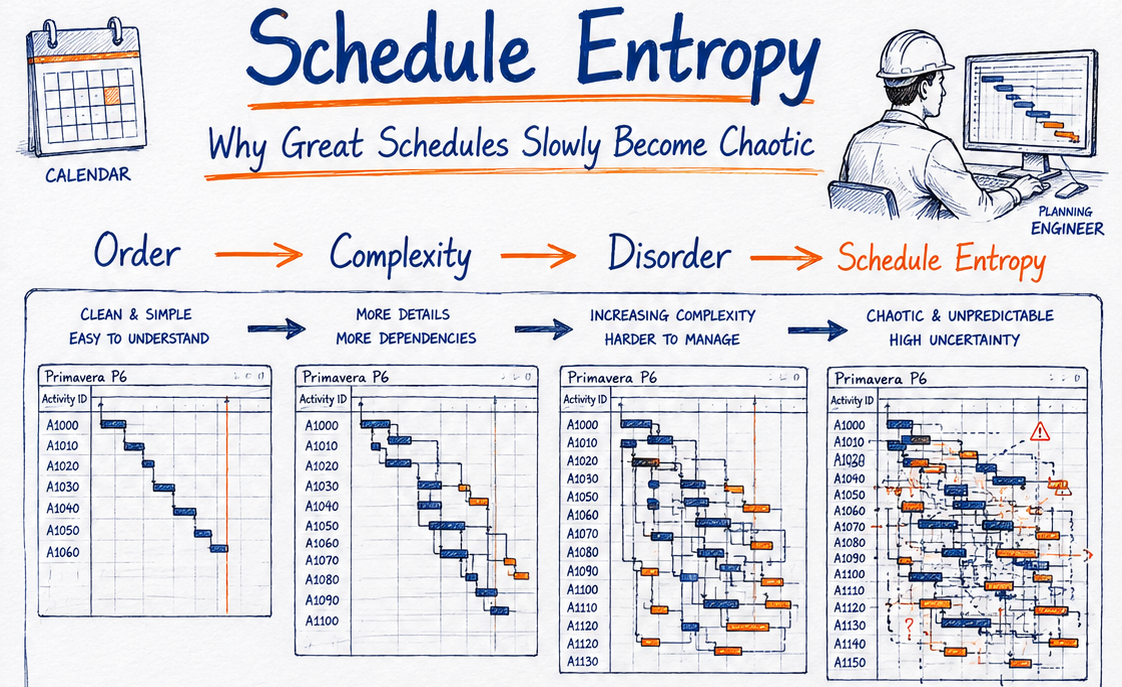
Nobody sets out to build a chaotic schedule. Every programme starts life as a careful, well-reasoned network — logic checked, resources considered, milestones aligned to the contract. And yet, month after month, otherwise excellent schedules slide quietly toward disorder. The forecast finish drifts. The critical path won't sit still. Reviewers start prefacing their questions with "I don't quite trust this date, but…". If that pattern sounds familiar, you're watching schedule entropy at work.
I want to approach this the way a project controls manager actually encounters it — not as a tidy theory, but as a set of symptoms that show up in your monthly report long before anyone uses the word "entropy". Once you can read those symptoms, the underlying causes and the cure both become obvious.
Reading the Warning Signs Before They Compound
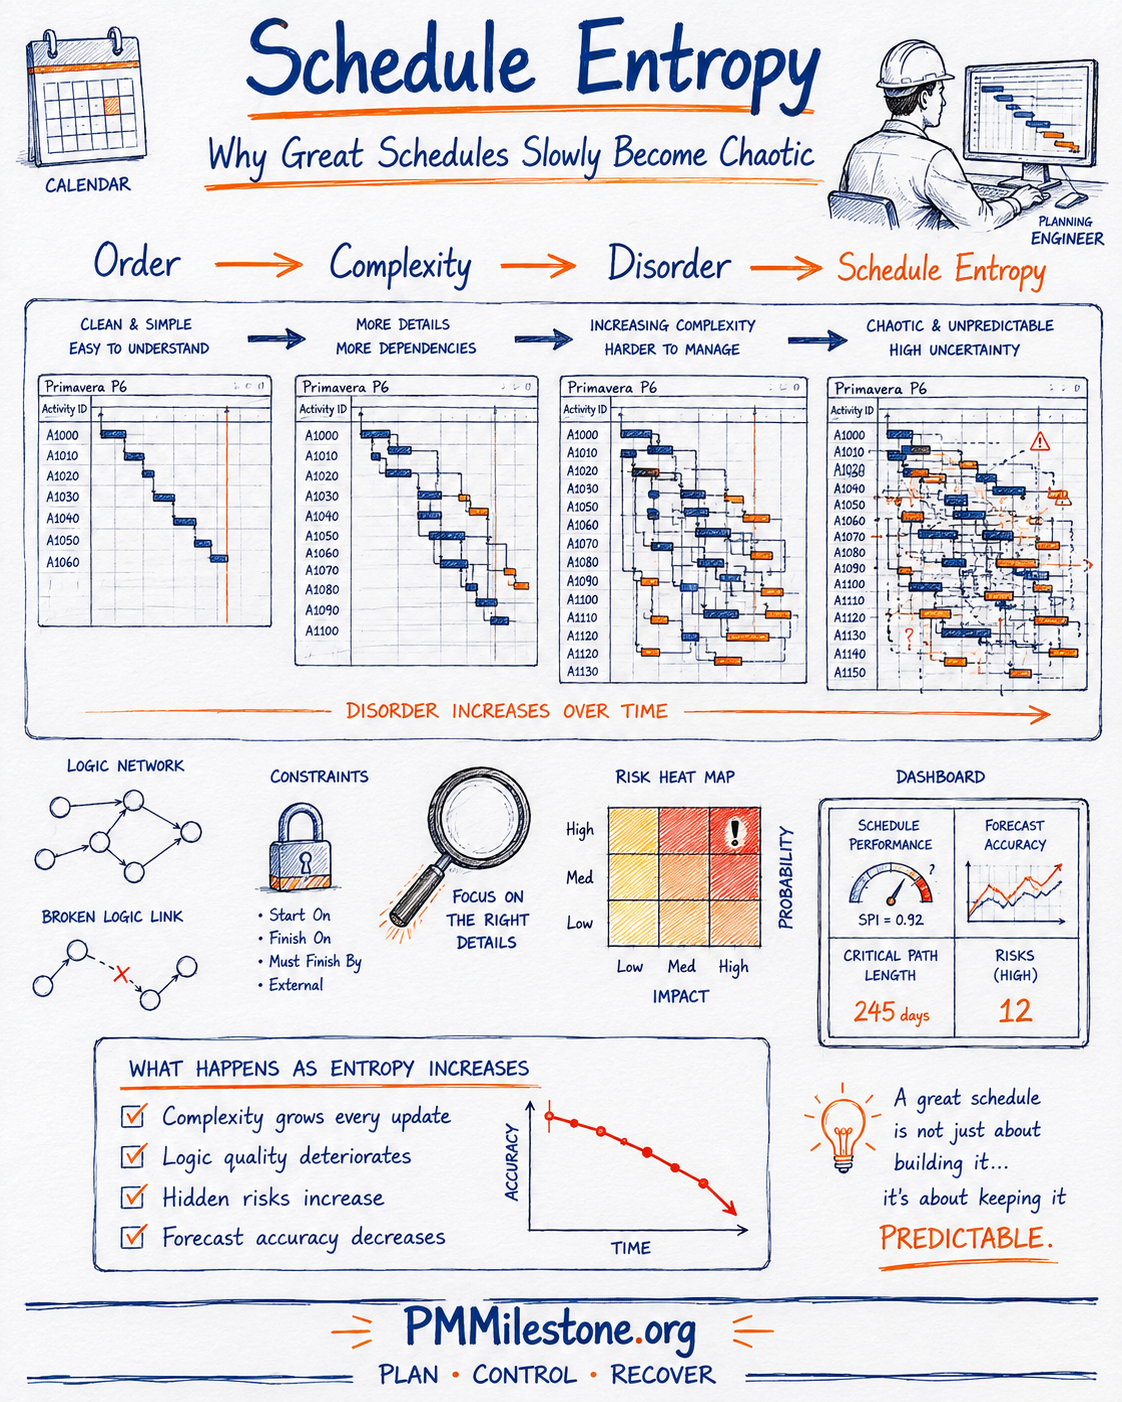
Entropy announces itself quietly. On a desalination plant programme I supported, the first symptom wasn't a slipped milestone — it was a forecast completion date that moved by two weeks in every direction across three consecutive updates, even though physical progress was steady. The dates were unstable because the network underneath them had become unstable. Here are the signals I now watch for first:
- A wandering forecast finish — the completion date changes each cycle for no physical reason.
- A jumping critical path — the longest path hops between different activity chains update to update. See Critical Path Method for why this matters.
- Rising constraint counts — more and more milestones are being forced rather than calculated. Read Schedule Constraints for the taxonomy.
- Out-of-sequence progress — activities reporting complete before their predecessors have started.
- Float that stops making sense — pockets of huge positive float next to unexplained negative float. Ground yourself with Float Management.
None of these is fatal on its own. Together, they are the fingerprints of a schedule that is accumulating disorder faster than it is being maintained.
What Schedule Entropy Actually Means
The term is borrowed, deliberately, from thermodynamics. The second law says an isolated system tends toward disorder unless energy is added to keep it ordered. A construction schedule behaves the same way. Left to accumulate careless edits, patched constraints and out-of-sequence progress, it will always trend toward chaos. The "energy" that resists this is planning discipline — the deliberate maintenance a controls team applies every cycle.
Crucially, this is more than a metaphor. Christodoulou, Ellinas and Aslani (2009) formalised entropy as a measure of project disorder for resource-constrained construction schedules, demonstrating that the tendency toward chaotic conditions can be quantified and used to evaluate schedule quality. That research-based perspective — low entropy versus high entropy — is exactly the lens a controls function should adopt.
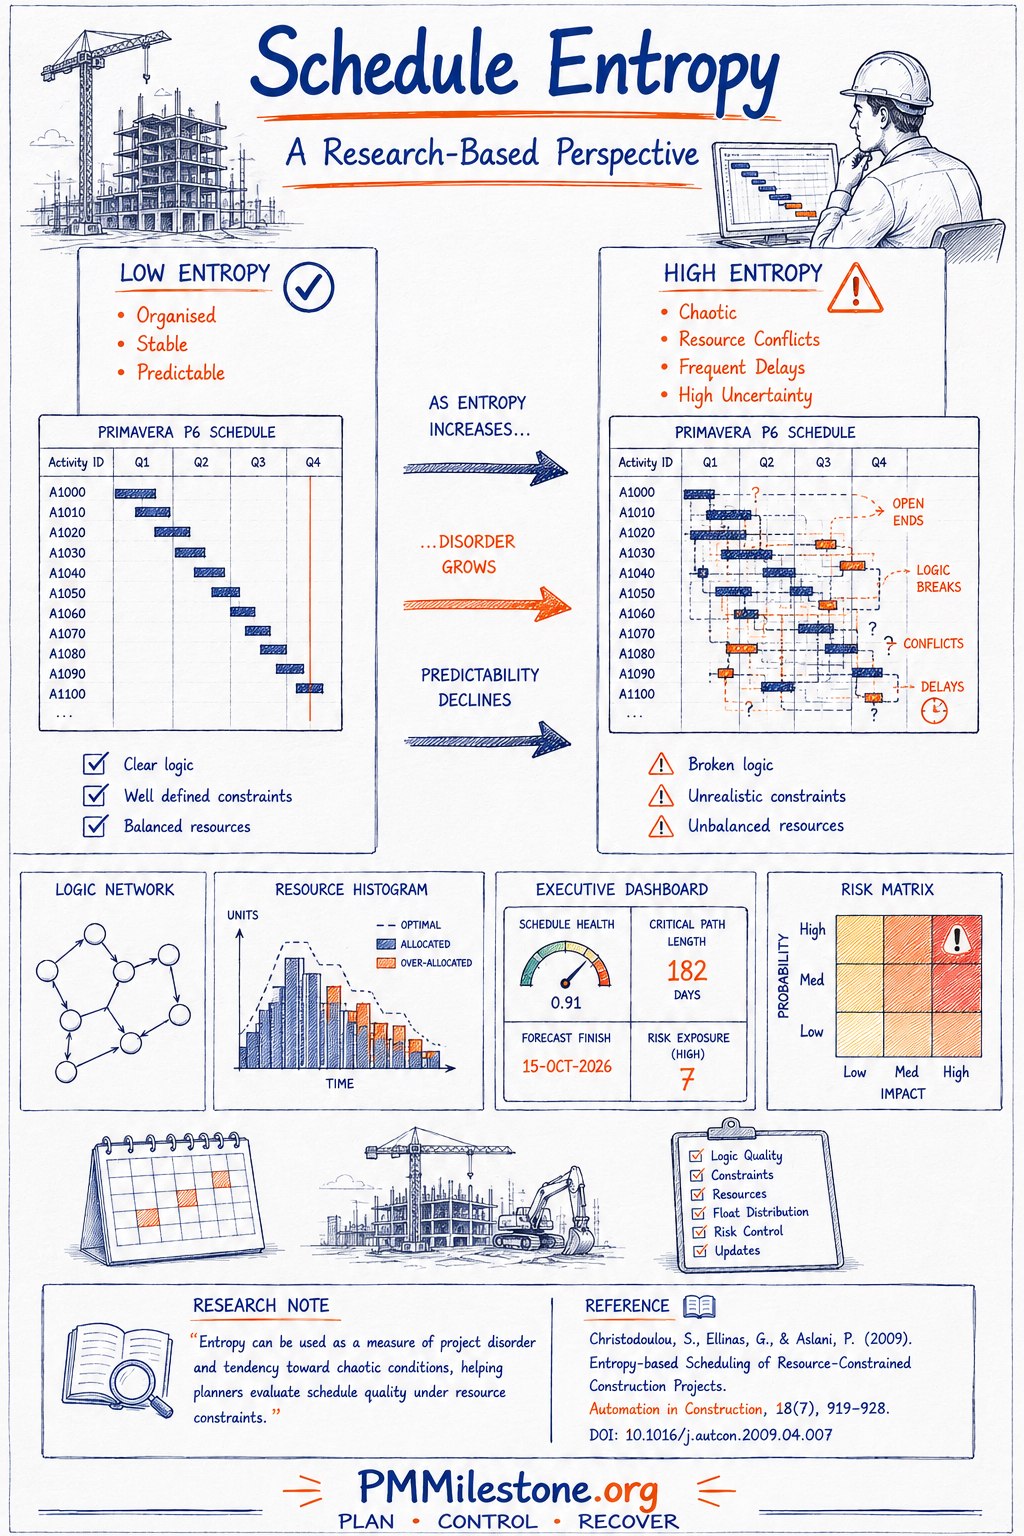
| Low entropy | High entropy |
|---|---|
| Organised | Chaotic |
| Stable | Resource conflicts |
| Predictable | Frequent delays |
| Clear logic, well-defined constraints, balanced resources | Broken logic, unrealistic constraints, unbalanced resources |
The practical significance is this: if disorder can be measured, it can be governed. You don't need the underlying mathematics to run the mindset. Any controls team can assemble a handful of proxy indicators and start trending its own entropy, exactly as it already trends cost and progress.
The Anatomy of Drift
Entropy is a process, not an event. It moves through four recognisable states, and the value of naming them is that each state calls for a different response. The progression runs from Order, through Complexity and Disorder, to full Schedule Entropy.
| Stage | Condition | Controls response |
|---|---|---|
| Order | Clean, legible, mostly finish-to-start logic | Protect it — resist unnecessary detail |
| Complexity | More detail and dependencies | Keep logic quality ahead of activity count |
| Disorder | Out-of-sequence, patch constraints, wandering forecast | Intervene on the specific driver, not the whole network |
| Entropy | Unreadable, override-driven dates | Re-baseline the affected segment |
On an airport terminal expansion, I watched a package walk through all four stages in under a year. The tender network was crisp. Detailed design tripled the activity count — healthy complexity. Then a compressed handover date drove the team to bolt on constraints instead of re-logic'ing, and within two updates the critical path was jumping between the baggage system, the apron works and the fit-out. That's the transition from disorder to entropy, and it's the point where trust in the schedule evaporates.
The Six Root Causes
Behind every high-entropy schedule sits some blend of the same six causes. Treat these as your diagnostic checklist when a programme starts drifting.
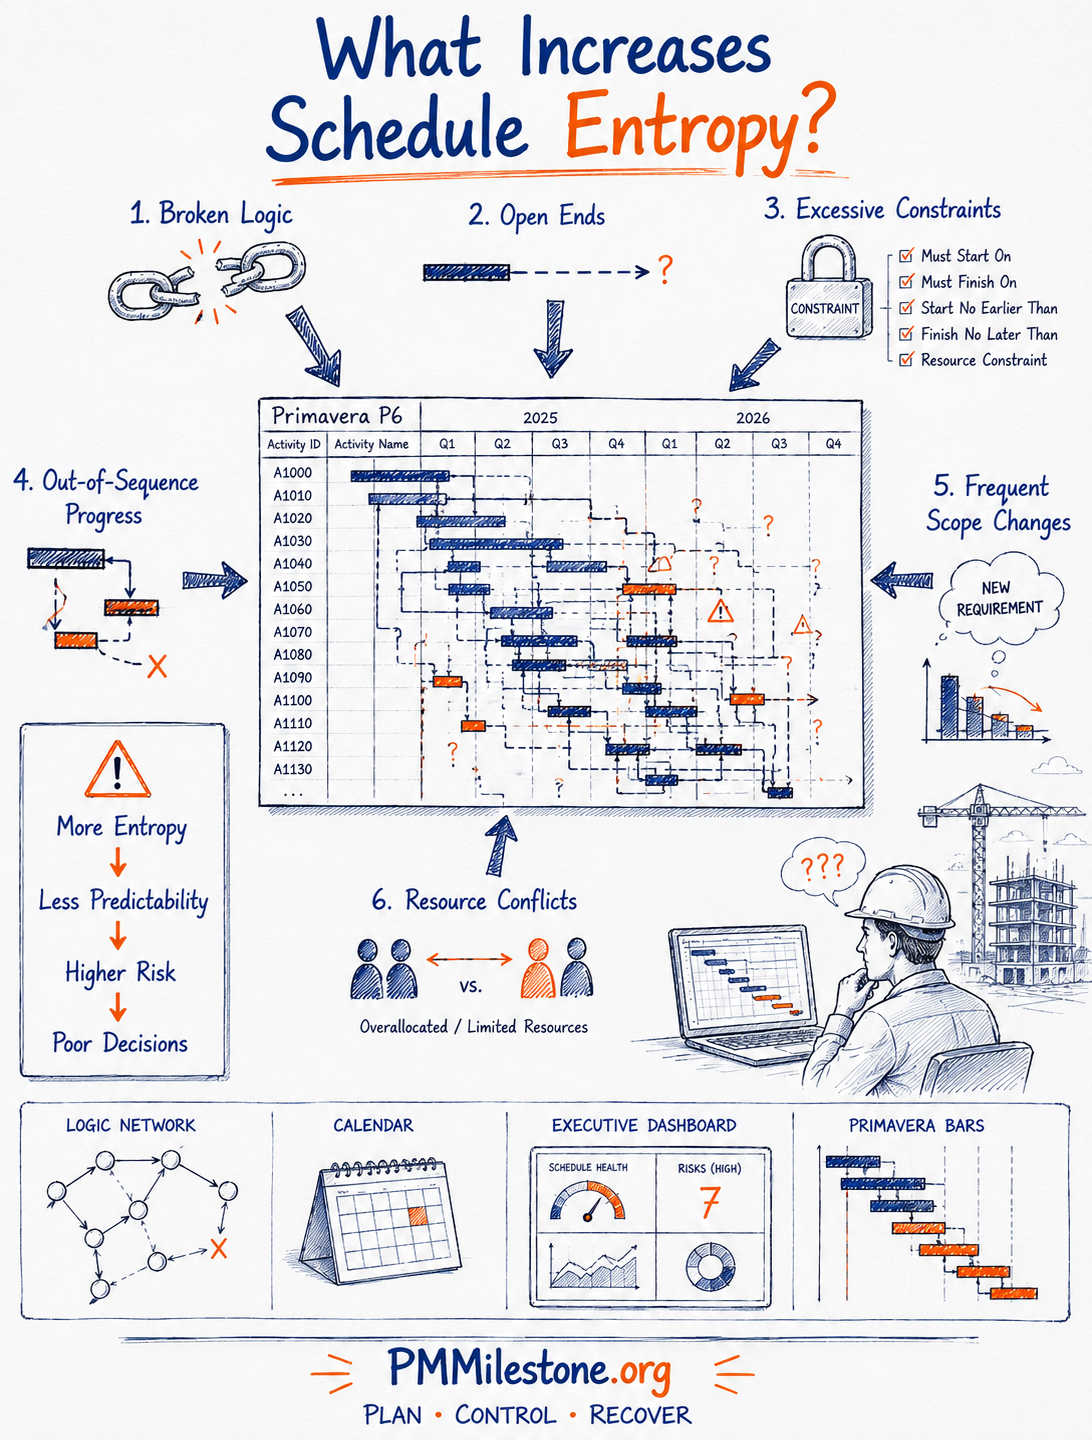
| # | Root cause | Field example | Remedy |
|---|---|---|---|
| 1 | Broken logic | Link deleted to green-up a board milestone | Re-establish true driving logic; never delete to report |
| 2 | Open ends | Dangling activities on a WWTP package | Ensure every task has a predecessor and successor |
| 3 | Excessive constraints | 40+ hard dates on a tower fit-out | Cap constraints; justify each contractually |
| 4 | Out-of-sequence progress | Cladding reported ahead of structure | Correct sequence or re-logic; review CPM flags |
| 5 | Frequent scope changes | New MEP requirement bolted on late | Fold change in cleanly with proper re-logic |
| 6 | Resource conflicts | Tower crane booked at 160% | Level resources; expose hidden delay |
The most damaging of these, in my experience, is excessive constraints. On a 40-storey commercial tower, a well-meaning planner had layered more than fifty hard constraints to keep the fit-out sequence looking achievable. Every one was a small lie told to the CPM engine. When the structure slipped a fortnight, the constraints held the downstream dates artificially still — right up to the moment they collapsed all at once. A constrained schedule doesn't warn you gradually; it fails suddenly.
Measuring the Slide
Because entropy accumulates gradually, the trend matters more than any single snapshot. The most reliable early indicator I've found is a quietly declining Schedule Performance Index paired with an unstable forecast. Read Earned Value Management for the mechanics, and use the SPI Calculator to trend your own project. The pattern below is typical: SPI drifts down a few points each period, and by the time it's obvious in a headline number, the disorder is already baked in.
| Monthly reporting period | Schedule Performance Index (SPI) |
|---|---|
| 1 | 1.00 |
| 2 | 0.99 |
| 3 | 0.99 |
| 4 | 0.98 |
| 5 | 0.97 |
| 6 | 0.95 |
| 7 | 0.94 |
| 8 | 0.92 |
| 9 | 0.91 |
| 10 | 0.90 |
| 11 | 0.89 |
| 12 | 0.88 |
Figure 4 — SPI decaying period by period as entropy accumulates. Watch the slope, not the single value.
The antidote to an unstable critical path is a legible one. A well-maintained, low-entropy schedule lets you point at the driving chain in seconds and shows total float honestly. The table below is what "order" should look like at review: the critical path in red, non-critical work in blue, and total-float tails in amber so everyone can see where the slack really lives.
| Activity | Start (wk) | End (wk) | Type | Float (days) |
|---|---|---|---|---|
| Enabling works | 2 | 6 | Critical (zero float) | — |
| Bulk excavation | 6 | 11 | Critical | — |
| Piling | 11 | 17 | Critical | — |
| Pile caps & ground beams | 17 | 25 | Non-critical | 3 |
| Basement slab | 25 | 32 | Critical | — |
| Core to L4 | 27 | 37 | Critical | — |
| MEP first fix | 34 | 46 | Non-critical | 6 |
| Facade procurement | 20 | 34 | Non-critical | 10 |
| Superstructure L5–L12 | 37 | 49 | Critical | — |
| Facade install | 49 | 59 | Non-critical | 2 |
| Fit-out | 55 | 65 | Critical | — |
| Commissioning | 65 | 65 | Critical | — |
Figure 5 — A low-entropy schedule reads clearly: critical path in red, float tails in amber.
A Worked Example: Entropy on a Hospital Fit-Out
Theory lands better with a real programme behind it, so here is a condensed version of one I know well.
A regional hospital fit-out — around 1,100 activities at baseline — was, by any measure, a strong schedule at contract award. The logic was 96% finish-to-start, there were only four hard constraints (all genuine contractual dates), and the resource histogram was smooth. On the entropy scorecard it would have scored green across the board.
The drift began, as it usually does, with reasonable-looking decisions. Coordinated design changes to the imaging suites arrived in three tranches. Rather than re-logic each change cleanly, the team bolted the new activities on and used Start-No-Earlier-Than constraints to hold them in place. By update six there were thirty-one hard constraints where there had been four. Simultaneously, the mechanical subcontractor began first-fix in areas where the ceiling grid wasn't complete, and that progress was reported out of sequence to keep the earned-value curve moving.
Individually, none of this looked alarming in the monthly report. Collectively, the schedule crossed from complexity into disorder. The tell was in the trend: the forecast completion date moved by nine days, then eleven, then seven in the opposite direction across three cycles, and the critical path migrated from the mechanical works to the medical-gas commissioning and back. The dates were technically calculated, but they were being steered by constraints, not logic — the classic signature of rising entropy.
The recovery was deliberately narrow. We didn't rebuild the whole programme. We isolated the imaging-suite and mechanical zones, stripped the constraints back to the four contractual ones, re-established true driving relationships, and corrected the out-of-sequence progress with a proper retained-logic decision. Two update cycles later the forecast finish stabilised to within two days a period and the critical path stopped wandering. The lesson I take from that job every time: entropy is almost always cheaper to reverse in a segment than to let spread across the whole network.
Reversing Entropy: The Elite-Planner Playbook
Entropy is reversible, but only through sustained discipline. The strongest planners don't rely on annual clean-ups; they apply a little energy every cycle. The infographic below summarises the disciplines; the scorecard that follows is what I actually govern against.
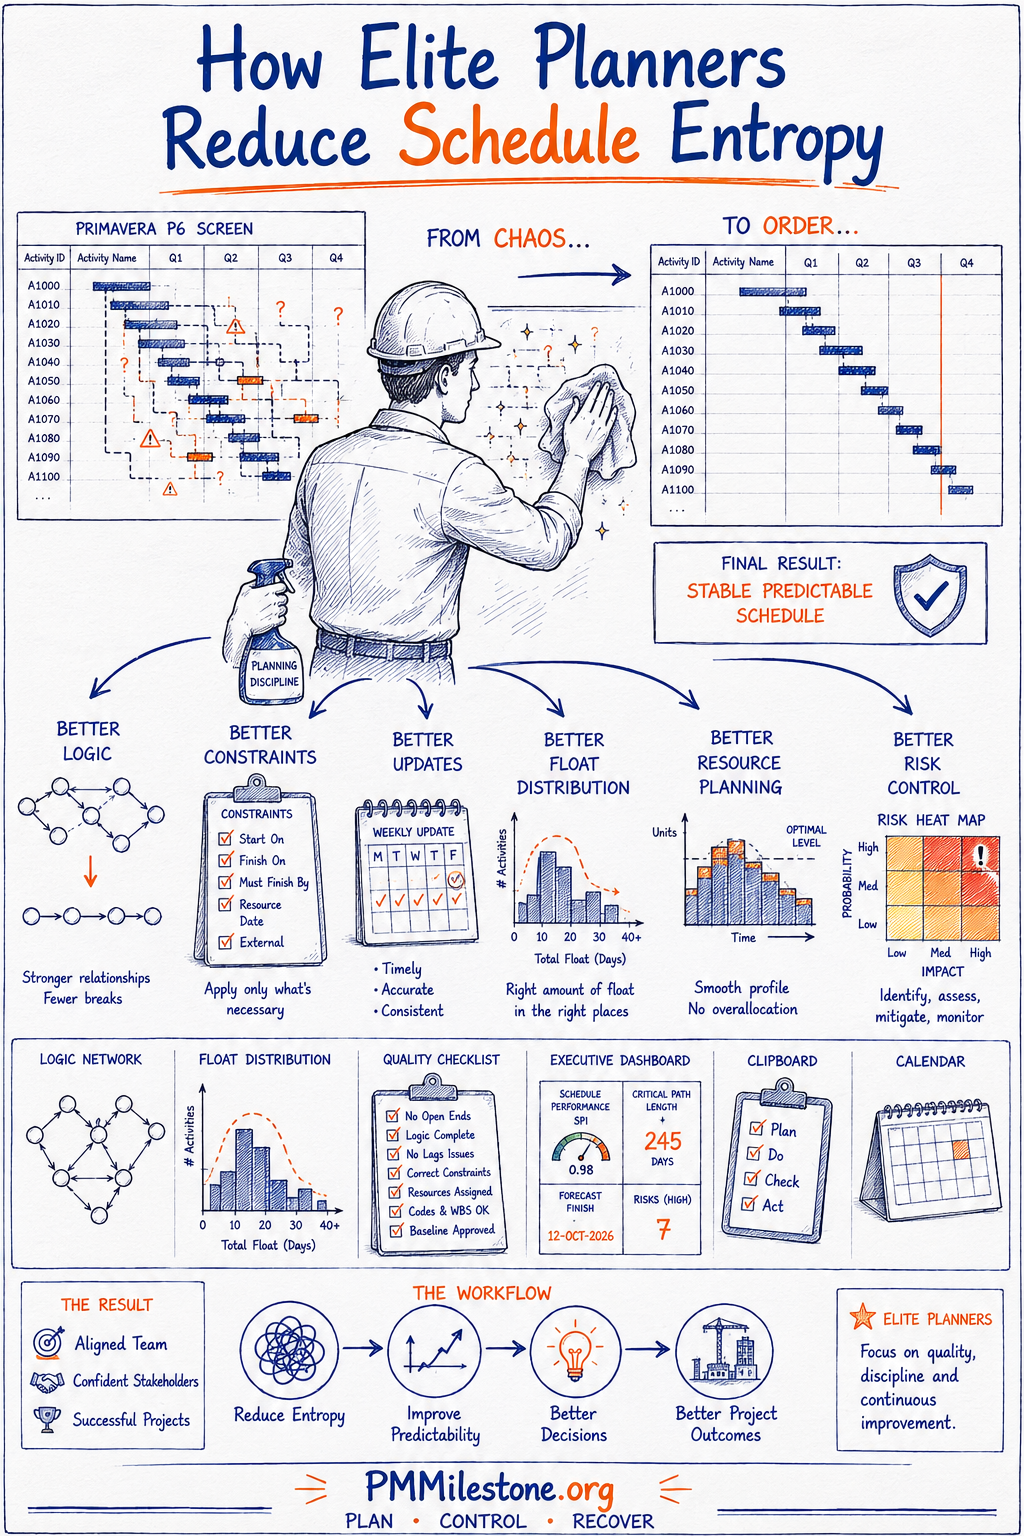
- Better logic — stronger relationships, fewer breaks. Aim for finish-to-start unless the physical process genuinely requires otherwise.
- Better constraints — apply only what's necessary; every hard date should trace to a contractual driver.
- Better updates — timely, accurate, consistent; the update ritual is the immune system of the schedule.
- Better float distribution — the right amount of float in the right places, not padding piled onto convenient activities.
- Better resource planning — smooth profile, no over-allocation; a schedule that ignores resources is a fiction.
- Better risk control — identify, assess, mitigate, monitor — and translate risk into schedule contingency you can defend.
The Entropy Health Scorecard
This is the one-page instrument I put in front of a project team. It converts a fuzzy sense of "the schedule feels messy" into six trackable numbers with clear thresholds.
| Indicator | Healthy (low entropy) | Warning | Action threshold |
|---|---|---|---|
| Open ends | 0 (excl. start/finish) | 1–3 | ≥ 4 |
| Hard constraints | < 5% of activities | 5–10% | > 10% |
| Out-of-sequence progress | 0% | 1–5% | > 5% |
| Forecast finish stability | ± 0–2 days / cycle | ± 3–7 days | > ± 7 days |
| Negative float | None | Isolated | Widespread |
| SPI trend | Stable / improving | Slow decline | Declining 3+ periods |
Governed weekly, this scorecard turns entropy from a vague worry into a managed metric. When a number crosses its action threshold, you intervene on that specific driver — not the whole schedule — which keeps the correction cheap and targeted.
Common Mistakes That Quietly Feed Entropy
- Forcing milestones with constraints instead of fixing the underlying logic.
- Reporting out-of-sequence progress and clicking through the CPM warnings.
- Growing the activity count endlessly without ever rolling up or pruning.
- Ignoring resource over-allocation because the dates still look fine today.
- Judging the schedule on a single snapshot instead of the multi-period trend.
- Doing the update but skipping the logic audit that should follow it.
Expert Tips for the Controls Function
- Trend six proxy indicators every cycle — that is your working entropy dashboard.
- Govern hard constraints with a cap and a documented, contractual justification for each.
- Re-baseline affected segments after major change rather than patching old logic. See Baseline Schedule for the governance around this.
- Make forecast-finish stability a standing item in the monthly schedule review.
- Level resources before you trust any date — hidden over-allocation is latent delay.
- Pair the entropy scorecard with a DCMA 14-point health check for a defensible, industry-recognised view.
Continue reading on PMMilestone
- Career context: How Expert Planners Read a P6 Schedule in 10 Minutes, Becoming a Senior Planning Engineer, How to Become a Delay Analyst.
- Encyclopedia foundations: Critical Path Method, Near-Critical Path, Float Management, Schedule Constraints, Baseline Schedule, Earned Value Management.
- Practical tools: Schedule Health Checker, SPI Calculator, EVM Calculator.
- Learning support: Project Controls Academy, Learning Tracks, PM Glossary.
References
- Christodoulou, S., Ellinas, G., & Aslani, P. (2009). Entropy-based Scheduling of Resource-Constrained Construction Projects. Automation in Construction, 18(7), 919–928. DOI: 10.1016/j.autcon.2009.04.007
- Project Management Institute. (2019). The Standard for Earned Value Management. Newtown Square, PA: PMI.
- Defense Contract Management Agency. (2012). 14-Point Schedule Assessment. Washington, DC: DCMA.
- AACE International. (2010). Recommended Practice No. 29R-03: Forensic Schedule Analysis. Morgantown, WV: AACE International.
- Winch, G. M., & Kelsey, J. (2005). What do construction project planners do? International Journal of Project Management, 23(2), 141–149.
Entropy is the quiet enemy of every credible schedule. Name it, measure it, and apply a little discipline every cycle — and the programme you hand over to the project director will still be the one you baselined.
Frequently Asked Questions
What is the earliest reliable sign of schedule entropy?
An unstable forecast finish date — one that moves every cycle without a physical cause — is usually the first symptom. It signals that the network beneath the dates has become unstable, even if headline progress looks steady. Watch it before you watch the dates themselves.Can the scheduling software prevent entropy on its own?
No. Primavera P6 or Microsoft Project will happily calculate a chaotic network. The tools surface the symptoms through health checks, but the discipline — auditing logic, controlling constraints, levelling resources — has to come from the planner. Software is a microscope, not an immune system.How often should I run an entropy check?
Fold a short check into every update cycle, weekly where possible. Trending your six proxy indicators each period catches disorder while the corrections are still small and cheap. An annual clean-up is far more expensive than a weekly discipline.Is re-baselining an admission of failure?
Not at all. After significant scope change, cleanly re-baselining the affected segment is far healthier than patching old logic with constraints. It's preventive maintenance, not a confession — and a well-governed re-baseline strengthens rather than weakens your entitlement position.What is the single most damaging entropy driver you see in practice?
Excessive hard constraints. They mask the true logic, hide impending slippage, and then fail suddenly rather than gradually. A schedule with more than 5–10% of activities under hard constraints is almost always steering with the handbrake on.How does schedule entropy relate to earned value?
A quietly declining SPI over several periods, with no obvious event driving it, is one of the strongest signals that entropy is accumulating in the underlying network. Trend the SPI and the forecast finish together — when both drift, the logic layer needs attention, not just the progress data.Does this apply to agile or hybrid programmes as well as construction?
The mechanism is identical. Any plan with dependencies, constraints and progress reporting can accumulate disorder. The proxy indicators change — release cadence stability, dependency count, story slicing quality — but the discipline of a weekly check against clear thresholds is the same.
People also ask
Follow-up questions practitioners search for next — each one points to the calculator, template or reference entry that answers it.
Which calculator should I learn first?
PV / EV / AC / CV / SV / CPI / SPI in one workbook — the gateway tool. EVM Calculator ↗
Which schedule tool will an interviewer expect me to know?
Runs the DCMA 14-point assessment against P6 / MS Project exports. Schedule Health Checker ↗
Where do I look up the terms in this guide?
Single-line definitions for 1,200+ project-management and controls terms. PM Glossary on PMMilestone.org ↗
Which books deepen this career path?
Field handbooks on project controls, P6 scheduling and EVM. Books & Publications ↗